Posts

Showing posts from May, 2018

Sigmoid Function in Python

Image
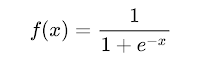
Its quite important to understand some of basic mathematical fundamentals before jumping directly into machine learning ocean. Sigmoid Function is one of mathematical function used in various machine learning algorithm ex. Logistic Regression , Neural Network etc. Usually Sigmoid functions are S shape curved used for predicting binary outputs. Few examples of sigmoid function are mentioned below. 1. Logistic Function 2. Hyperbolic Tangent 3. Error Function I am going to attempt to plot first two Sigmoid function using Python and Matlab Plot. Logistic Function : import matplotlib.pylab as plt import numpy as np def sigmoidFunction (x): sigFunction = 1 / ( 1 + np . exp( - x)) return sigFunction rangeX = np . arange( - 10 , 10 , 0.2 ) plt . plot(rangeX , sigmoidFunction(rangeX)) #Define Lables plt . grid() plt . title( 'Sigmoid Function' ) plt . xlabel( 'X Aixis' ) plt . ylabel( 'Y Function (Hy

Plotting Matrix using Python

Image
I have recently started to sharpen my machine learning skills and exploring couple of new interesting problems. In my college,  I was quite good in mathematics but really haven't seen so far its implementation but machine learning is place where I find out its true use case. Let me start with something very basic and going forward in couple of blogs share my experience of machine learning - Shift from Data Engineering to Machine Leaning Engineering. Today I used Python and Matlab API to plot a 2-D matrix. Its quite exciting and good to see something colorful. Specially for a person like me who has always spend his most of time in back-white screen(linux terminal). Pre-requisite : I have installed Jupyter notebook (most popular in data scientist) using Anaconda. Now I am going to create a matrix using numpy followed by matlab to plot. Source Code : import numpy as np 
 import matplotlib.pyplot as matrixPlot 
 #Create a matrix A = np . matrix( '1,2,