RHive - Integration of R and Hive with simple demo
RHive is package that can be used for writing hive queries in R.User can import RHive library in R and then one can start writing hive queries in it. Today we are going to do installation of R and some simple example to demonstrate power of R.
Notes: All commands shown below are executed and tested on Cent OS 6.x
Before we proceed , we need certain things in place. Since I have used Cents OS, I installed couple of pre-requisite that is required before we begin with RHive installation.
Install Ant : This is required for building and packaging project.Below is a command to install it.
sudo yum install ant
|
Install JDK
sudo yum install java-1.6.0-openjdk
|
Set JAVA_HOME in .bashrc file
export JAVA_HOME=/usr/lib/jvm/java-1.6.0-openjdk-1.6.0.36.x86_64
|
Install git
sudo yum install git
|
Set up your HIVE_HOME and HADOOP_HOME
export HIVE_HOME=/usr/lib/hive
export HADOOP_HOME=/usr/lib/hadoop
|
Once this is done, you will have to install R and RStudio for accessing hive and demonstrating example.
For R installation , you can simply do
sudo yum install R and for RStudio you can simply run below command.
wget https://download2.rstudio.org/rstudio-server-rhel-0.99.484-x86_64.rpm
sudo yum install --nogpgcheck rstudio-server-rhel-0.99.484-x86_64.rpm
|
Note: Above RStudio command is with respect to my machine configuration , you can check on rstudio site for command compatible with your machine.
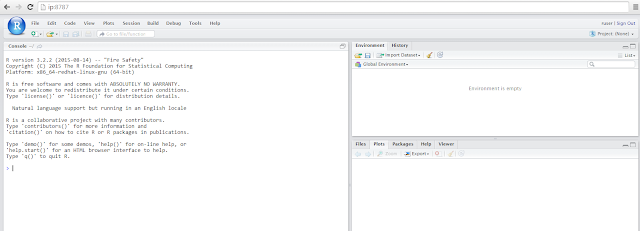
To check RStudio server is accessible, open your browser and type below address
http://ip:8787
ip :IP address of your machine where you have installed RSutdio server.
Above URL should give RStudio web page.
Now you have installed and configured all pre-requisite required for RHive installation. Now get ready to clone RHive repository and install RHive package in R.
git clone https://github.com/nexr/RHive.git
cd Rhive
ant build
R CMD build RHive
wget https://cran.r-project.org/src/contrib/rJava_0.9-7.tar.gz
wget https://cran.r-project.org/src/contrib/Rserve_1.7-3.tar.gz
R CMD INSTALL rJava_0.9-7.tar.gz
R CMD INSTALL Rserve_1.7-3.tar.gz
R CMD INSTALL RHive_2.0-0.10.tar.gz
|
Once above command are completed successfully, you are ready to use RHive.
Now just to test your installation start R shell and type below command to check if you get output.
library(RHive)
rhive.init()
rhive.connect(ip,port,hiveServer2)
rhive.query("show databases")
Above command should list all databases present in hive , if doesn't then please re-check your configurations.
Lets draw 3D pie chart using R now. Before this we need to have sample data in hive which can be accessed through R.
For this I have created a simple Student table. Here is a command to create student hive table.
create table Students(
Sname String,
score int,
subject String
)
row format delimited
fields terminated by '|'
stored as TextFile;
Sample Input file for student table.
Here I am going to create student performance pie chart. Based marks scored in computer subject, they will be given Poor,Good etc grade.
Here is my R script.I am not a good R programmer but I have tried my best perfect result.:P
library(RHive)
rhive.init()
rhive.connect(ip,10000)
poor <- rhive.query("select count(score) from students where score <=25")
avgs <- rhive.query("select count(score) from students where score >25 and score <=40")
goodst <- rhive.query("select count(score) from students where score >40 and score <=75")
vgoods <- rhive.query("select count(score) from students where score >75")
a = as.integer(poor)
b = as.integer(avgs)
c = as.integer(goodst)
d = as.integer(vgoods)
marks <- c(a,b,c,d)
lbls <- c("Very Poor", "Average", "Good" ,"Very Good")
pct <- round(marks/sum(marks)*100)
lbls <- paste(lbls, pct) # add percents to labels
lbls <- paste(lbls,"%",sep="") # ad % to labels
pie3D(marks,labels = lbls, col=rainbow(length(lbls)),
main="Pie Chart of Student Performance")
|
Output from above
Reference:
https://github.com/nexr/RHive
https://github.com/nexr/RHive
Hope this will help....:)


Comments
Post a Comment